Detailed Guide to Detecting and Analyzing a Kerberoasting Attack in Active Directory Using Splunk
Detecting and investigating a Kerberoasting attack on Active Directory in Splunk, from the attack steps to the event 4769 fields that give it away.
Originally published on Medium.
On this page
In an Active Directory (AD) environment, the Domain Controller (DC) is a central, sensitive asset that attackers often target to gain elevated access within an organization. In this guide, we’ll walk through an investigation of a Kerberoasting attack, using Splunk and Prefetch files to gather evidence. We’ll analyze the forensic process step-by-step to show how an attack is detected, examined, and understood using the Hack the Box’s “Campfire” lab as our scenario.
Active Directory and Domain Controller Importance
Link to section: Active Directory and Domain Controller ImportanceActive Directory manages user access and permissions across an organization and is central to user authentication. It uses Kerberos as its primary authentication protocol, which is based on service tickets that grant access to various network services. The Domain Controller, a key component of AD, maintains this structure and is often a primary target for attackers. Compromising the DC allows unauthorized access to accounts, the ability to change user permissions, and, in severe cases, even the deployment of ransomware.
Understanding Kerberoasting and Attack Methodology
Link to section: Understanding Kerberoasting and Attack MethodologyWhat is Kerberoasting?
Link to section: What is Kerberoasting?Kerberoasting is a post-exploitation technique, meaning it’s used after the attacker has gained some level of access to the network. It focuses on obtaining a password hash from accounts that have an associated Service Principal Name (SPN). SPNs are linked to services on the network, and attackers can request service tickets for these SPNs, capturing the ticket encrypted with the service account’s password hash.
Kerberoasting Steps:
Link to section: Kerberoasting Steps:-
Gain Initial Access: The attacker needs a basic AD account (often obtained through phishing or other initial access techniques).
-
Request Service Ticket: The attacker uses their access to request a service ticket for an SPN.
-
Receive Encrypted Ticket: The ticket, encrypted with the service account’s password hash, is delivered to the attacker.
-
Crack the Ticket Offline: The attacker attempts to crack the hash offline, revealing the plaintext password for that service account.
This understanding directs us to look for log events indicating Kerberos service ticket requests and accounts with SPNs, as these may signal Kerberoasting activity.
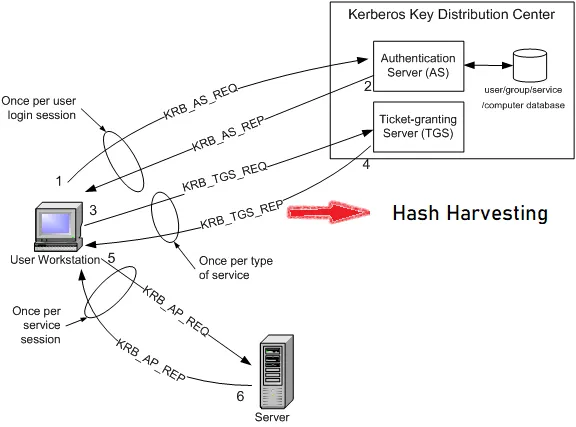
Steps of a Kerberoasting attack within an AD environment
Setting Up the Lab and Understanding the Attack Scenario
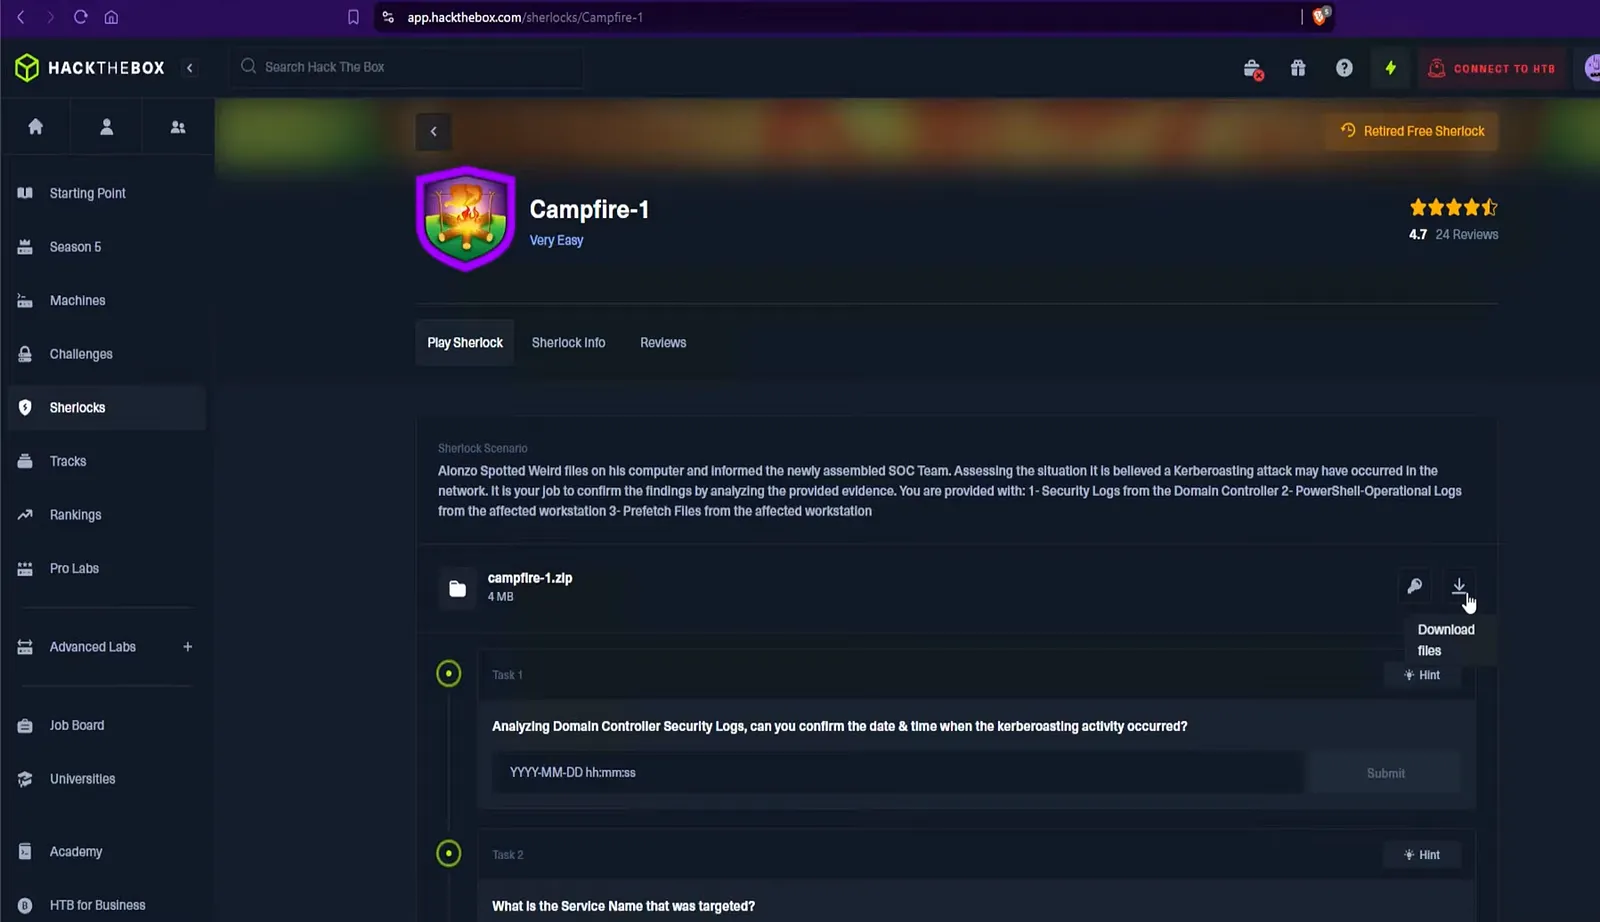
Link to section: Setting Up the Lab and Understanding the Attack ScenarioIn this lab scenario, a suspicious Kerberoasting attack was reported by an employee, and it is now up to the Security Operations Center (SOC) team to investigate. Hack the Box provides access to the necessary log files:
-
Security logs from the Domain Controller
-
PowerShell operational logs from the workstation
-
Prefetch files from the workstation
These logs contain key insights into the timing, tools, and accounts involved in the attack, allowing us to trace back the attacker’s activities.
Step 1: Setting Up Splunk for Log Analysis
Link to section: Step 1: Setting Up Splunk for Log AnalysisConfiguring Splunk to Monitor Logs
To detect and analyze the Kerberoasting attack, we need to load and configure Splunk to monitor logs from the DC and the affected workstation.
-
Upload Security Logs and PowerShell Operational Logs: We load the log files provided in the “Campfire” scenario (e.g., DC security logs and PowerShell logs from the workstation) into Splunk.
-
Create an Index: Creating a unique index for this investigation, such as “campfire,” keeps the data organized and easily searchable.
Creating a specific index enables efficient and organized searches, preventing data overlap with other investigations.
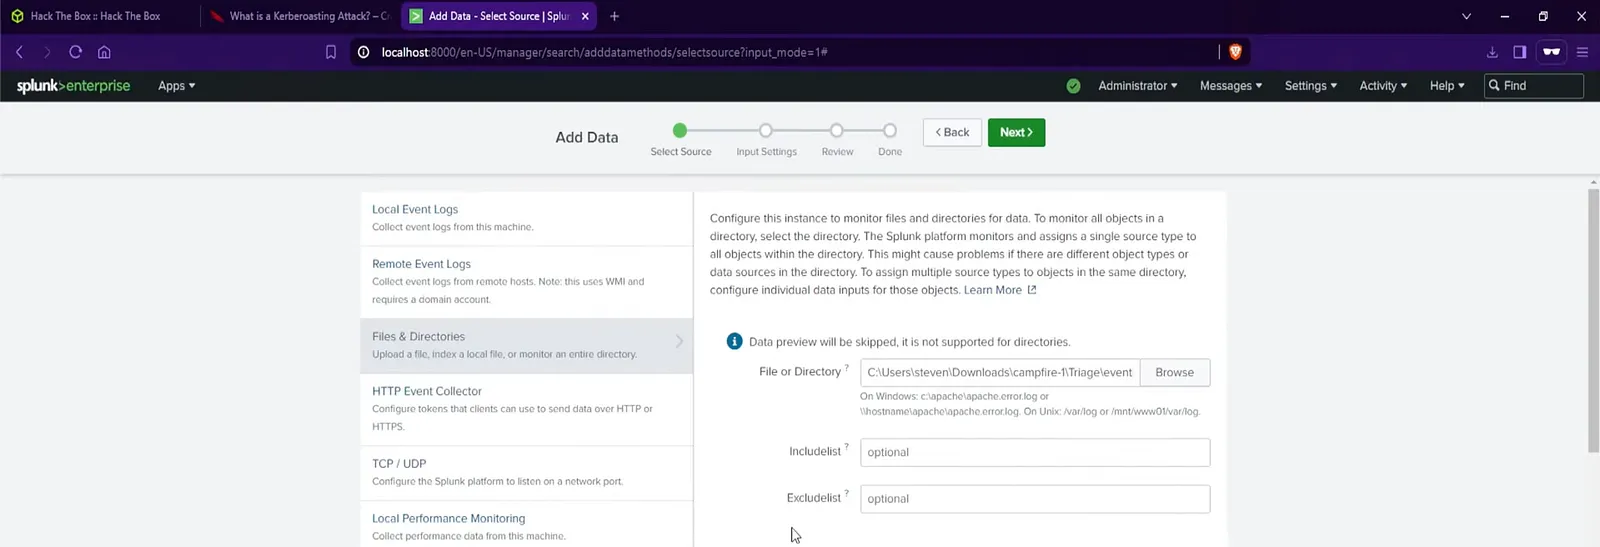
Screenshot: Log files from Domain Controller and workstation for analysis
Step 2: Setting Time Zone to UTC in Splunk
Link to section: Step 2: Setting Time Zone to UTC in SplunkEnsuring Consistent Time Analysis
Log timestamps must be consistent across all records to ensure accurate event tracking. AD logs are often in UTC, but Splunk defaults to the system time zone. To align all timestamps, change the Splunk time zone to UTC:
- Go to User Preferences > Time Zone and select GMT.
By setting a unified time zone, we avoid potential discrepancies between log timestamps, ensuring that events correlate accurately.
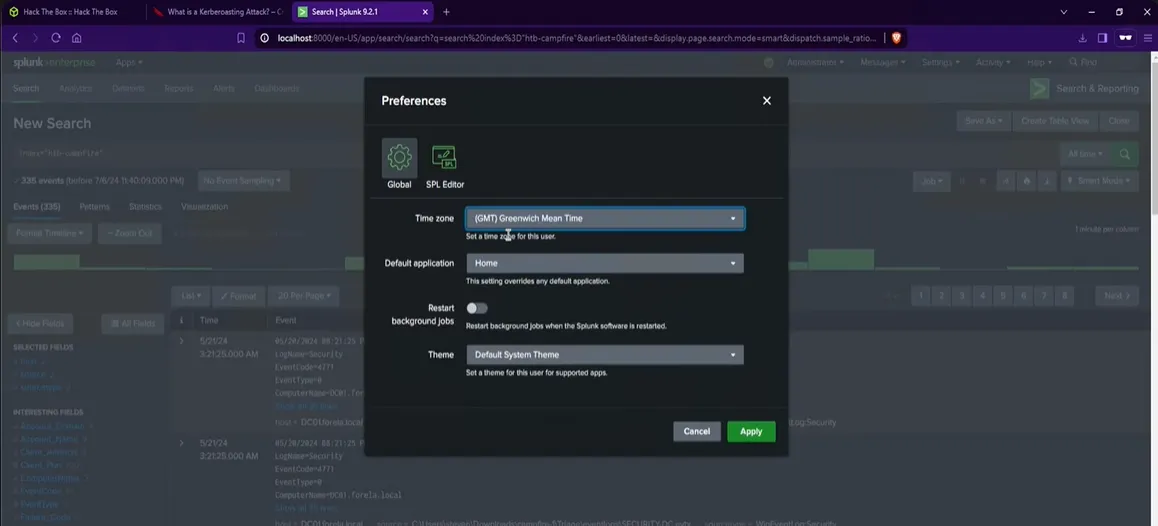
Screenshot: Splunk interface showing log monitoring setup
Step 3: Filtering for Kerberoasting Activity
Link to section: Step 3: Filtering for Kerberoasting ActivityIdentifying Suspicious Kerberos Service Ticket Requests
Kerberoasting attacks are often flagged by Event ID 4769, which represents Kerberos service ticket requests. In this attack, the attacker requests a Kerberos ticket for a service account to extract the password hash.
- Run a Splunk Search for Event ID 4769:
index="campfire" EventCode="4769"This search retrieves all events where a service ticket was requested, helping us spot Kerberos activity that may be indicative of Kerberoasting.
Focusing on Event ID 4769 isolates Kerberos service ticket requests, allowing us to quickly find possible Kerberoasting attempts without sifting through unrelated data.
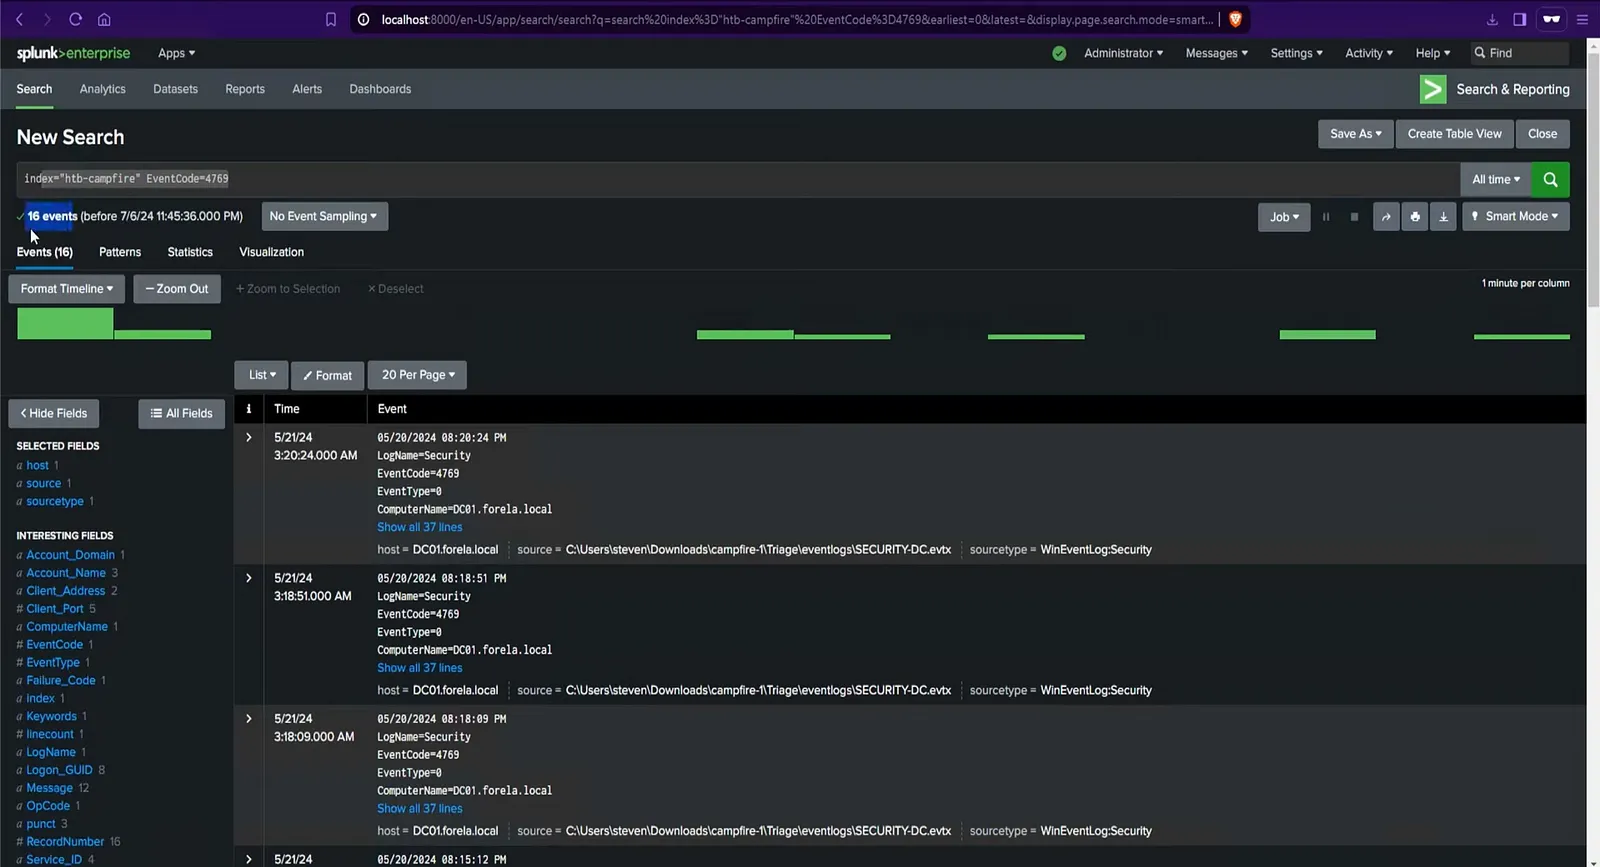
Screenshot: Splunk query for Event ID 4769
Step 4: Excluding Host-Based Accounts in Splunk
Link to section: Step 4: Excluding Host-Based Accounts in SplunkNarrowing Results to Potentially Vulnerable Accounts
Since Kerberoasting typically targets user accounts, we can exclude any events where the service account has a $ symbol at the end (a convention for host-based accounts). Host-based SPNs use longer, complex passwords that are regenerated frequently, making them much harder to compromise.
- Refine the Search to Exclude Host Accounts:
index="campfire" EventCode="4769" ServiceName!="*$"This command filters out host accounts, allowing us to focus on user accounts that are more likely to be targeted in a Kerberoasting attack.
Excluding host accounts lets us hone in on user accounts, making it easier to identify truly suspicious activity that could indicate Kerberoasting.
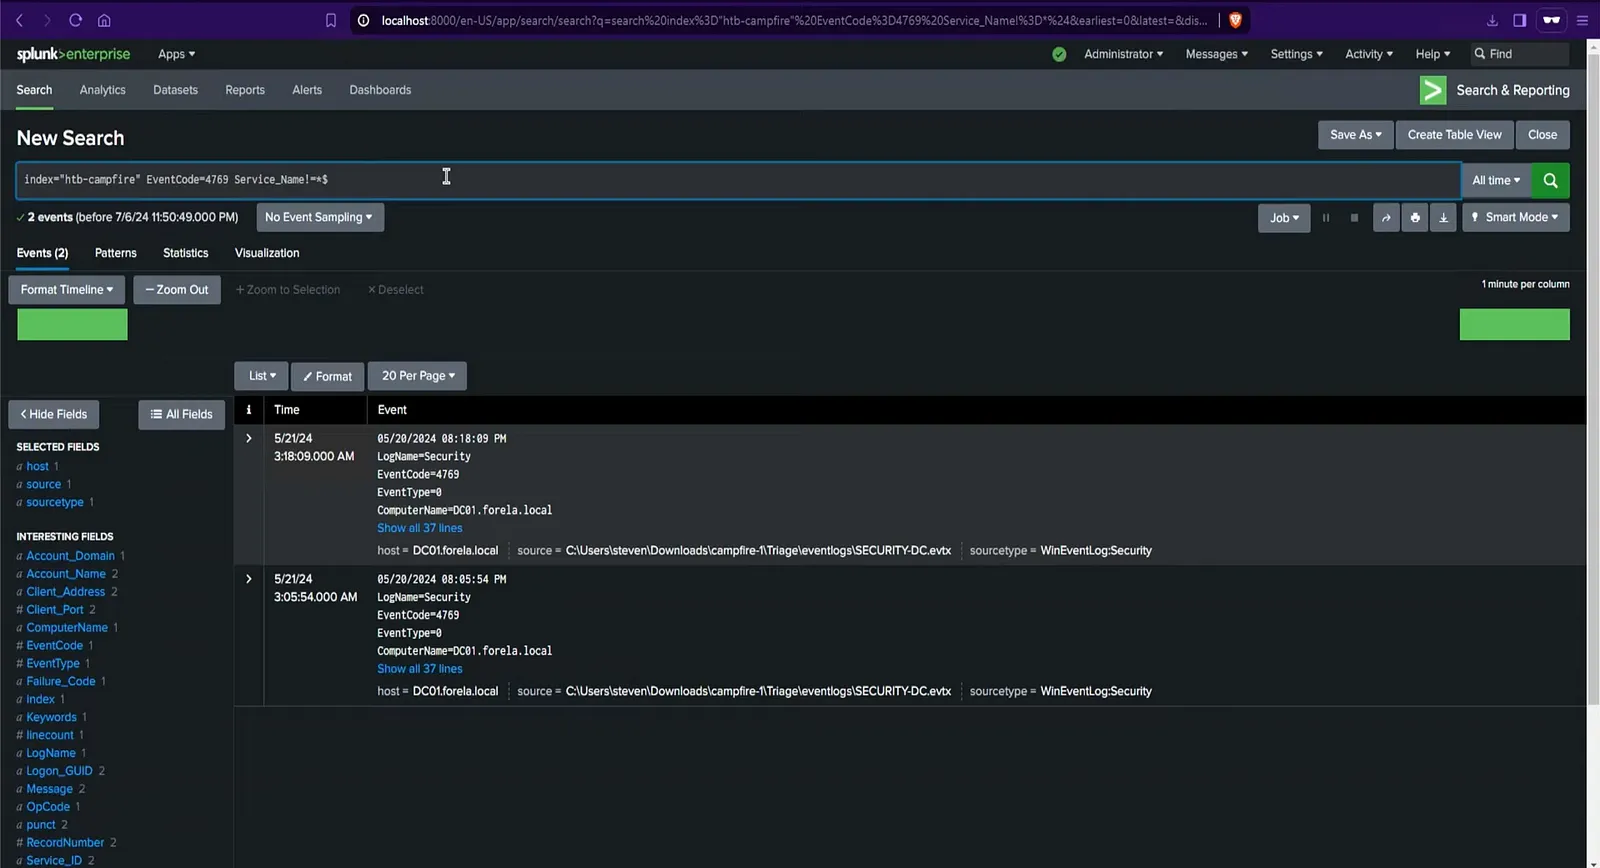
Screenshot: Splunk query for Event ID 4769 filtering out host-based accounts
Step 5: Analyzing Event Details to Identify Kerberoasting
Link to section: Step 5: Analyzing Event Details to Identify KerberoastingExamining Log Events for Indicators of Compromise
Reviewing the remaining events, we look for specific signs of Kerberoasting:
-
User Account as the Requester: In our scenario, we see that Alonzo.dospire requested a ticket for mssqlservice. This indicates that a user account (rather than a system account) requested access, aligning with Kerberoasting behavior.
-
Weak Encryption Type (0x17): Weak encryption types like
0x17make ticket cracking easier, so spotting this in the logs raises suspicion.
Identifying a user-initiated ticket request for a service account with weak encryption type points to likely Kerberoasting activity. We log the event timestamp and details for further investigation.
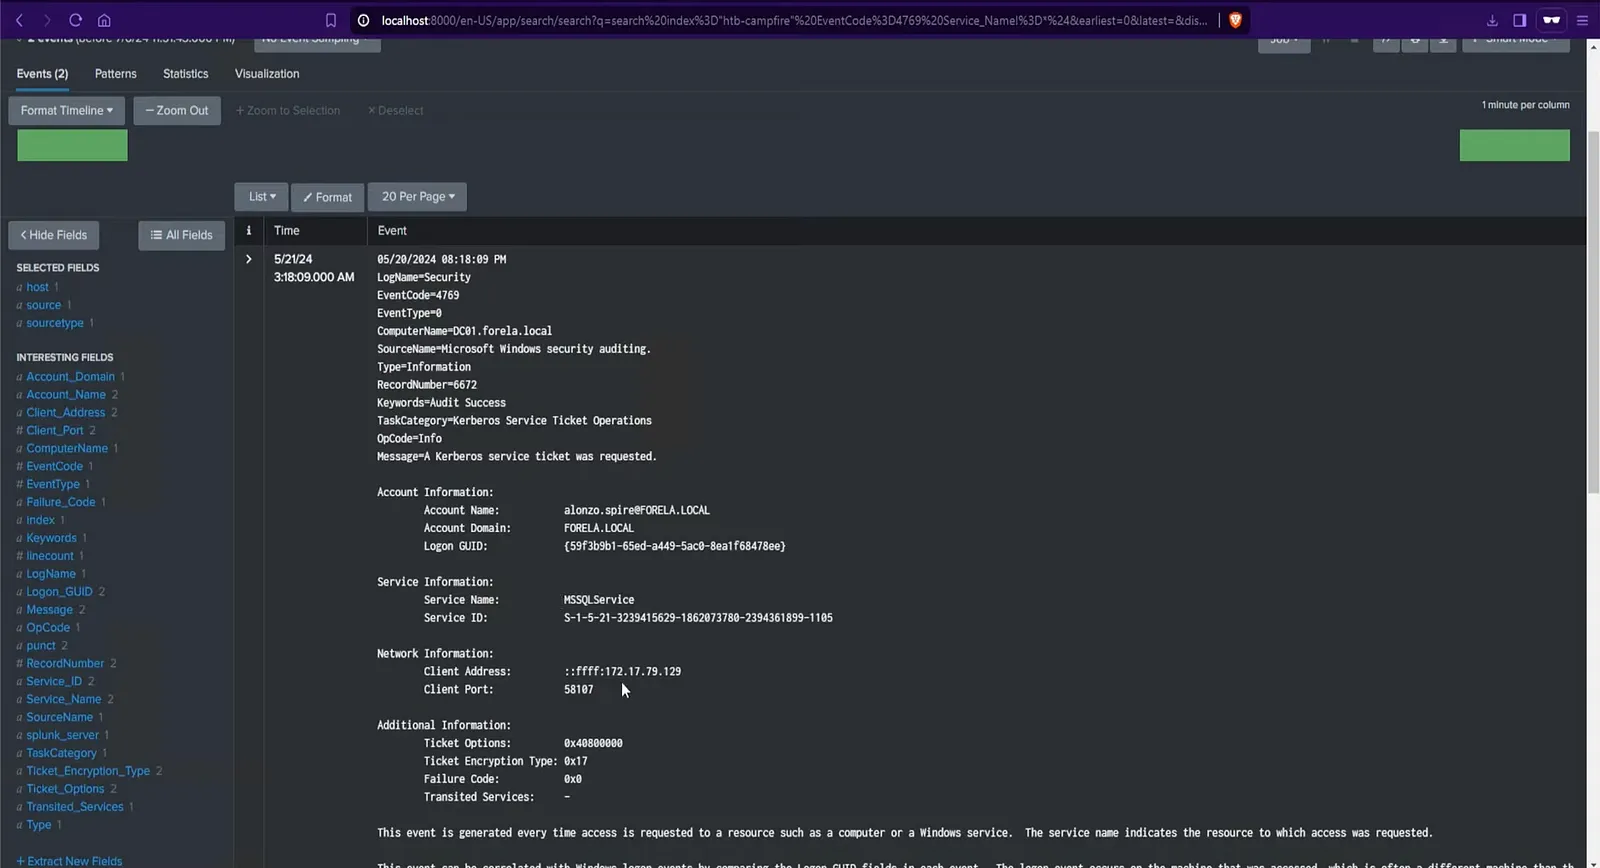
Screenshot: Splunk output showing service request details for Alonzo.dospire
Step 6: Identifying PowerShell Script Execution with Prefetch Files
Link to section: Step 6: Identifying PowerShell Script Execution with Prefetch FilesPowerShell Execution Analysis Using Prefetch Files
In AD environments, attackers frequently use PowerShell scripts to perform enumeration and discover SPNs. In this case, PowerShell logs reveal the execution of PowerView.ps1, a known enumeration tool for AD environments.
1. Search PowerShell Logs for PowerView Execution: The PowerShell logs in Splunk show that PowerView.ps1 was executed on May 21, 2024, at 03:16:32 UTC. PowerView is commonly used to enumerate AD objects, making it a likely precursor to the Kerberoasting attempt.
PowerShell logs indicate that PowerView was likely used for reconnaissance. We note this timestamp to correlate with other logged events.
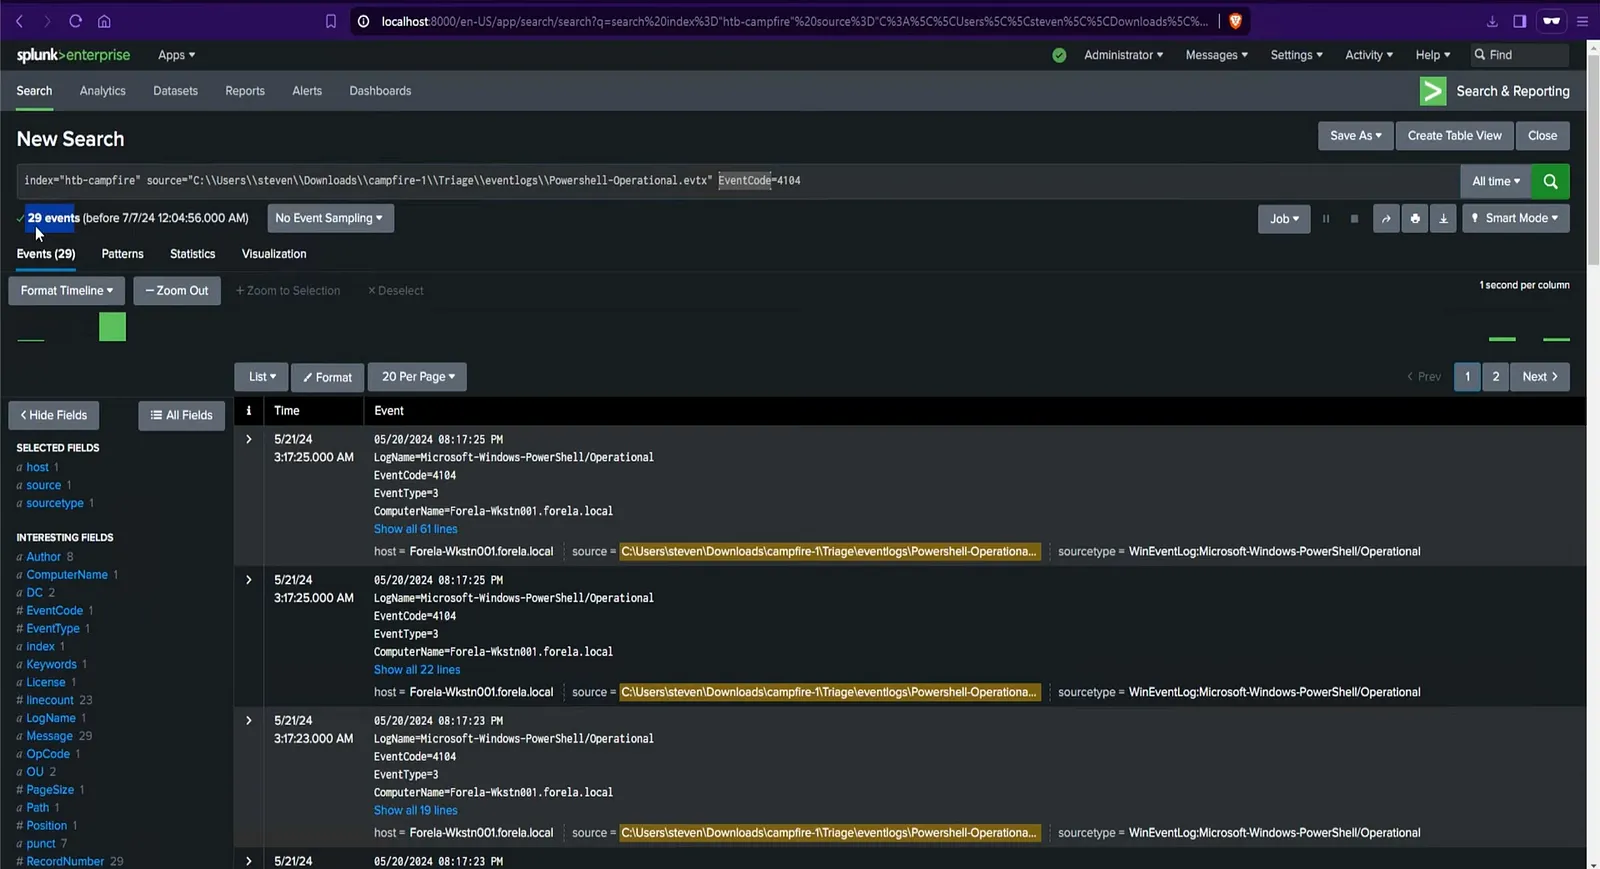
Screenshot: Prefetch data analysis showing PowerView execution details
Step 7: Using Prefetch Files to Identify Credential Dumping with Rubeus
Link to section: Step 7: Using Prefetch Files to Identify Credential Dumping with RubeusTracing Rubeus Execution for Credential Dumping
Prefetch files log details of executed files, showing when and how often they were run. In our case, Prefetch files capture the execution of Rubeus.exe at 03:18:08 UTC from the workstation’s downloads folder. Rubeus is a tool often used to exploit Kerberos tickets, confirming credential-dumping activity following the PowerView enumeration.
- Parsing Prefetch with PECmd: Use Eric Zimmerman’s PECmd tool to parse Prefetch files and generate a CSV of the execution timeline.
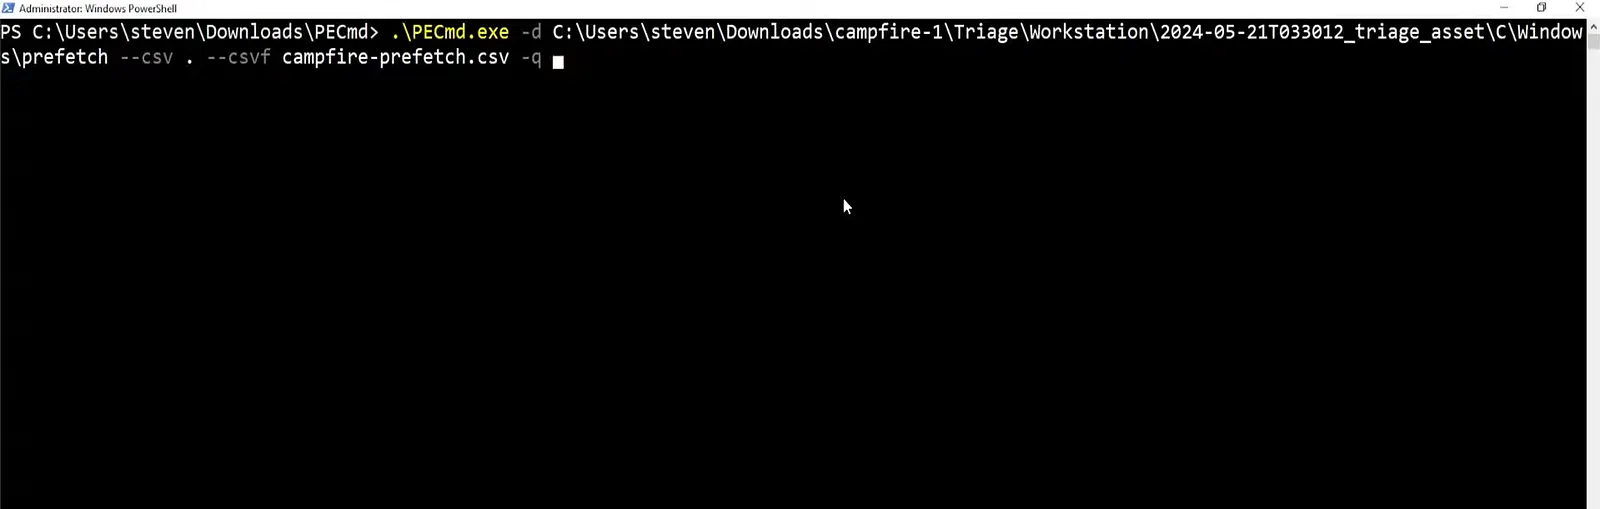
Prefetch files and generate a CSV of the execution timeline
- Filtering Execution Times in Timeline Explorer: Filter the timeline by date to pinpoint when Rubeus and PowerView were executed, identifying the exact sequence.
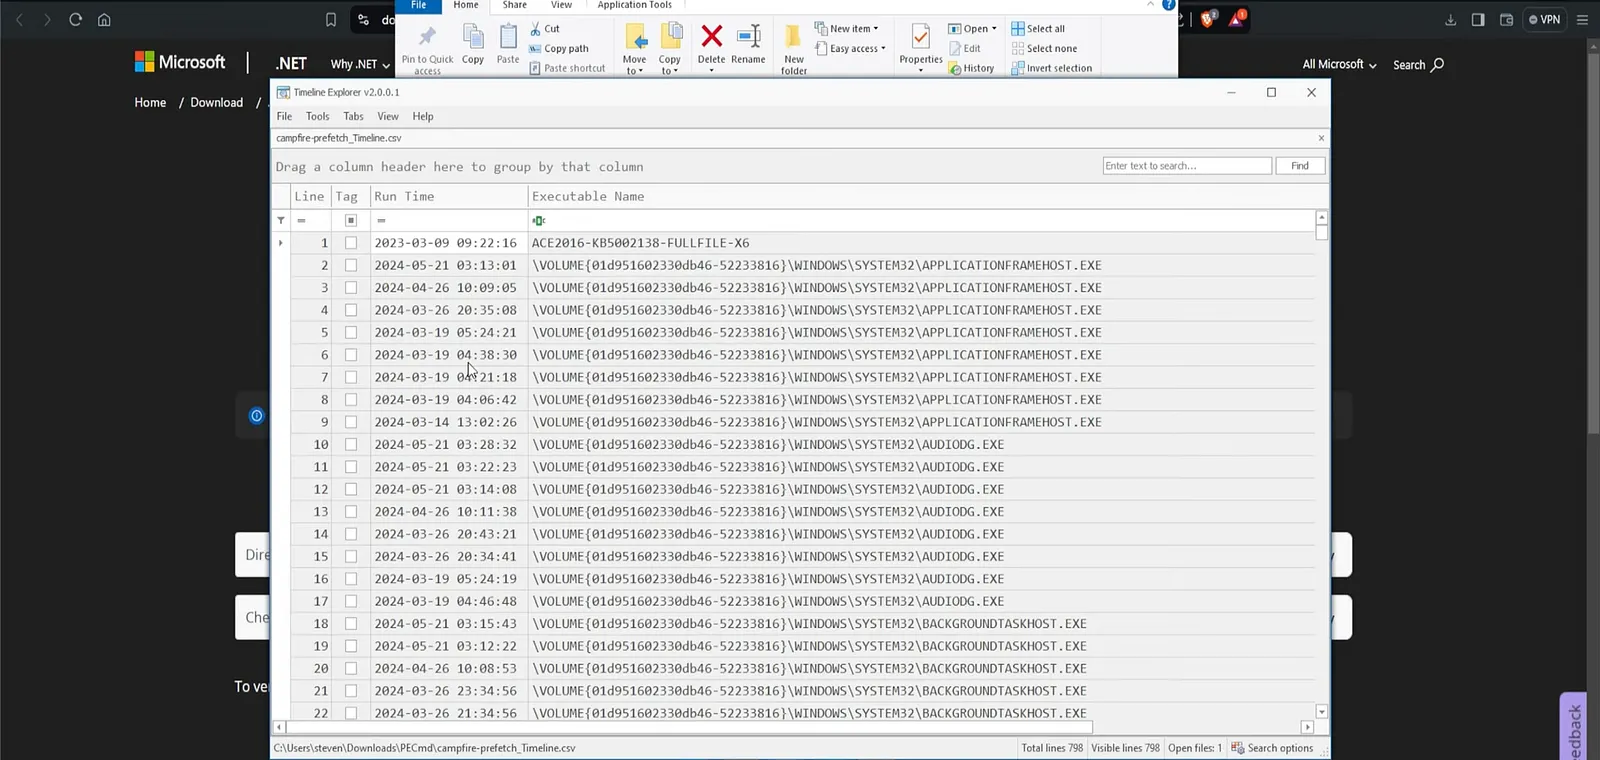
Screenshot: Timeline Explorer interface showing filtered execution files
By confirming the execution of Rubeus after PowerView, we have a clear timeline showing reconnaissance followed by credential dumping. Prefetch provides evidence of execution without relying on just log data, adding a crucial layer to our findings.
Step 8: Summary of Findings and Key Indicators of Compromise
Link to section: Step 8: Summary of Findings and Key Indicators of CompromiseDocumenting Attack Chain and Indicators of Compromise
We have identified the following indicators of compromise:
-
Event Timeline: PowerView ran at 03:16:32, followed by Rubeus at 03:18:08, showing a pattern typical of reconnaissance followed by credential exploitation.
-
Weak Encryption (0x17): The use of a weak encryption type for Kerberos tickets aligns with Kerberoasting methods.
-
Prefetch Evidence: Prefetch confirms the tools used and the timeline of execution, providing evidence independent of log files.
By documenting these findings, we establish a clear timeline and methodology for the attack, giving a detailed report that can be used by other security teams for prevention and awareness.
Documenting each finding reinforces our understanding of the attack path and helps ensure that we have all the necessary details for reporting and recommending preventive measures.
Step 11: Mitigation Recommendations to Protect Active Directory from Kerberoasting
Link to section: Step 11: Mitigation Recommendations to Protect Active Directory from KerberoastingImplementing Preventive Measures
To prevent Kerberoasting attacks in production environments, consider implementing these mitigations:
-
Enforce Strong Passwords: Apply complex passwords for service accounts to slow offline cracking.
-
Deploy Multi-Factor Authentication (MFA): MFA minimizes the risk of unauthorized access if credentials are compromised.
-
Proactive Log Monitoring: Regularly monitor Event ID 4769 and unusual PowerShell activities.
-
Behavioral Analytics and Threat Hunting: Utilize tools like CrowdStrike Falcon for proactive threat detection and blocking.
These steps improve security by addressing vulnerabilities exploited in Kerberoasting, reducing the likelihood of unauthorized access to AD service accounts.
Conclusion
Link to section: ConclusionThis guide provides a step-by-step walkthrough of detecting and analyzing a Kerberoasting attack. By carefully examining Spl
unk logs and Prefetch files, we identified suspicious activity, linked it to specific attack stages, and pieced together a timeline of the attack. Through careful analysis and documentation, we established an evidence-backed report detailing how Kerberoasting attacks occur, how they’re detected, and the importance of monitoring, detection tools, and security controls to safeguard AD environments.
Understanding and implementing these steps will strengthen your cybersecurity skills, helping you to better protect your organization’s AD infrastructure.